I recently purchased a reMarkable 2 e-ink tablet with the goal of modernizing my note-taking process. My end goal is to make my handwritten notes searchable.
It seems the reMarkable is doing some sort of line simplification before sending the raw x, y coordinates to the MyScript Handwriting Recognition Service (HWR) service.
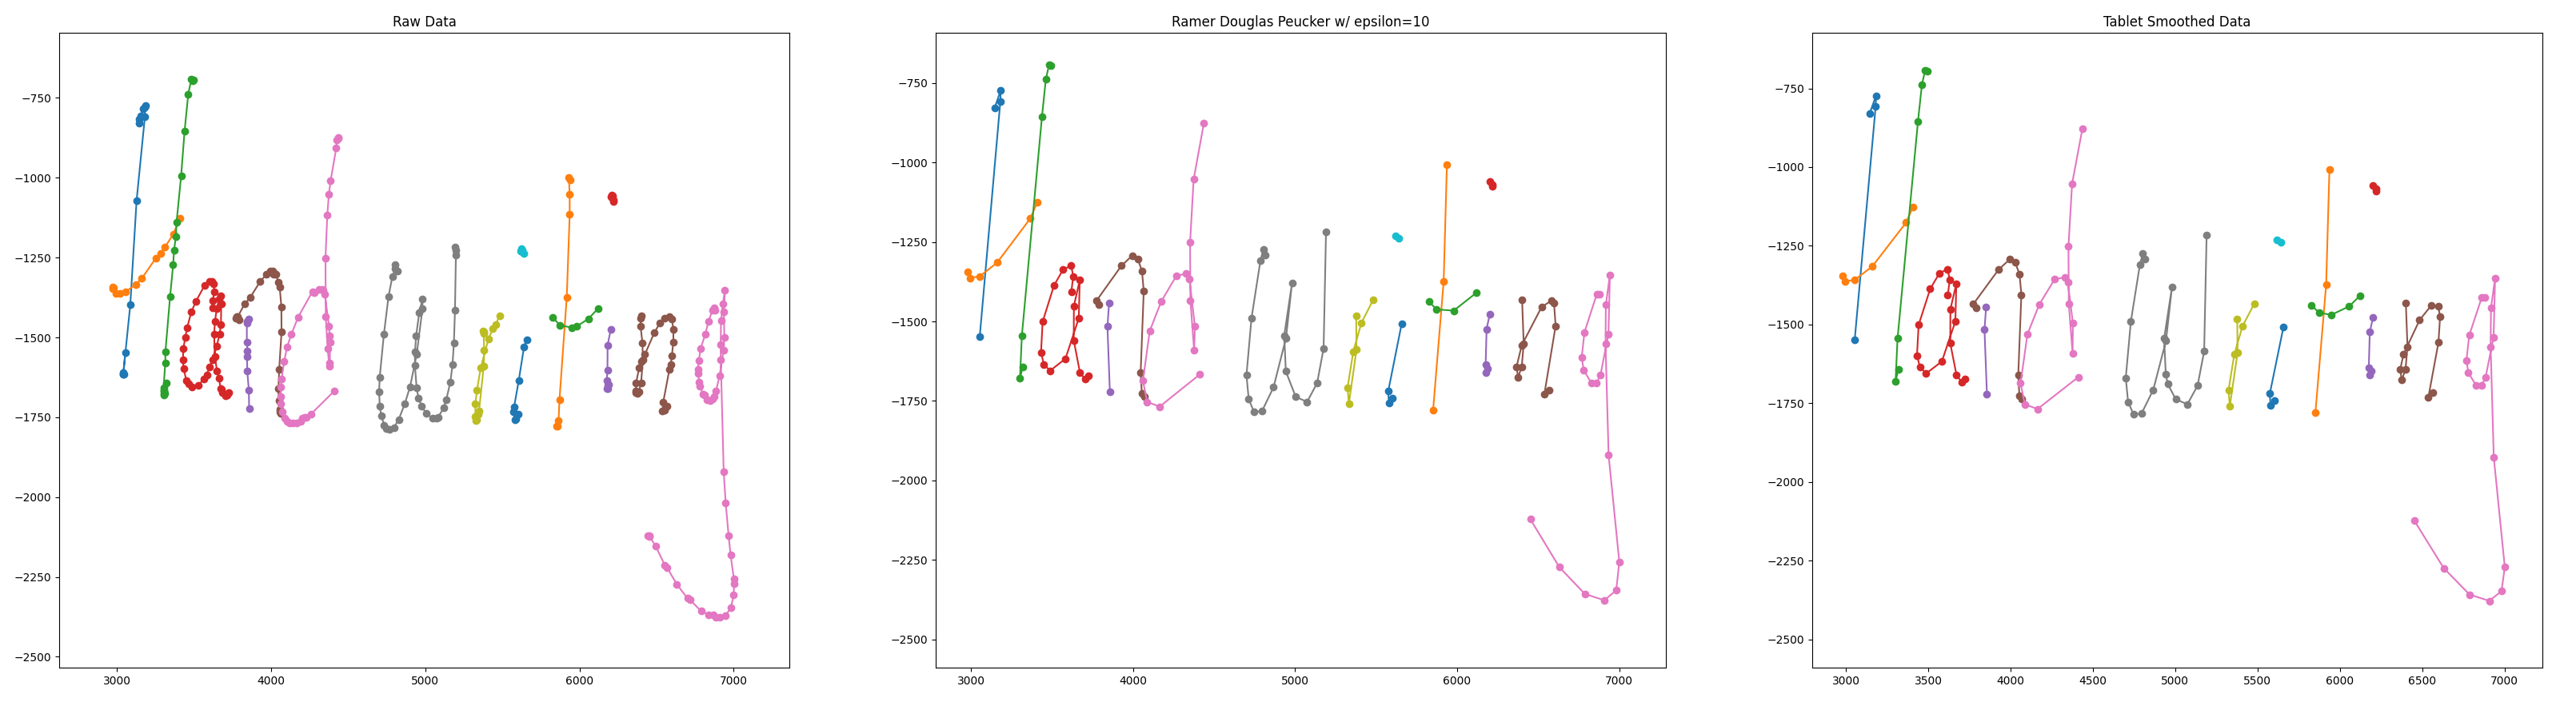
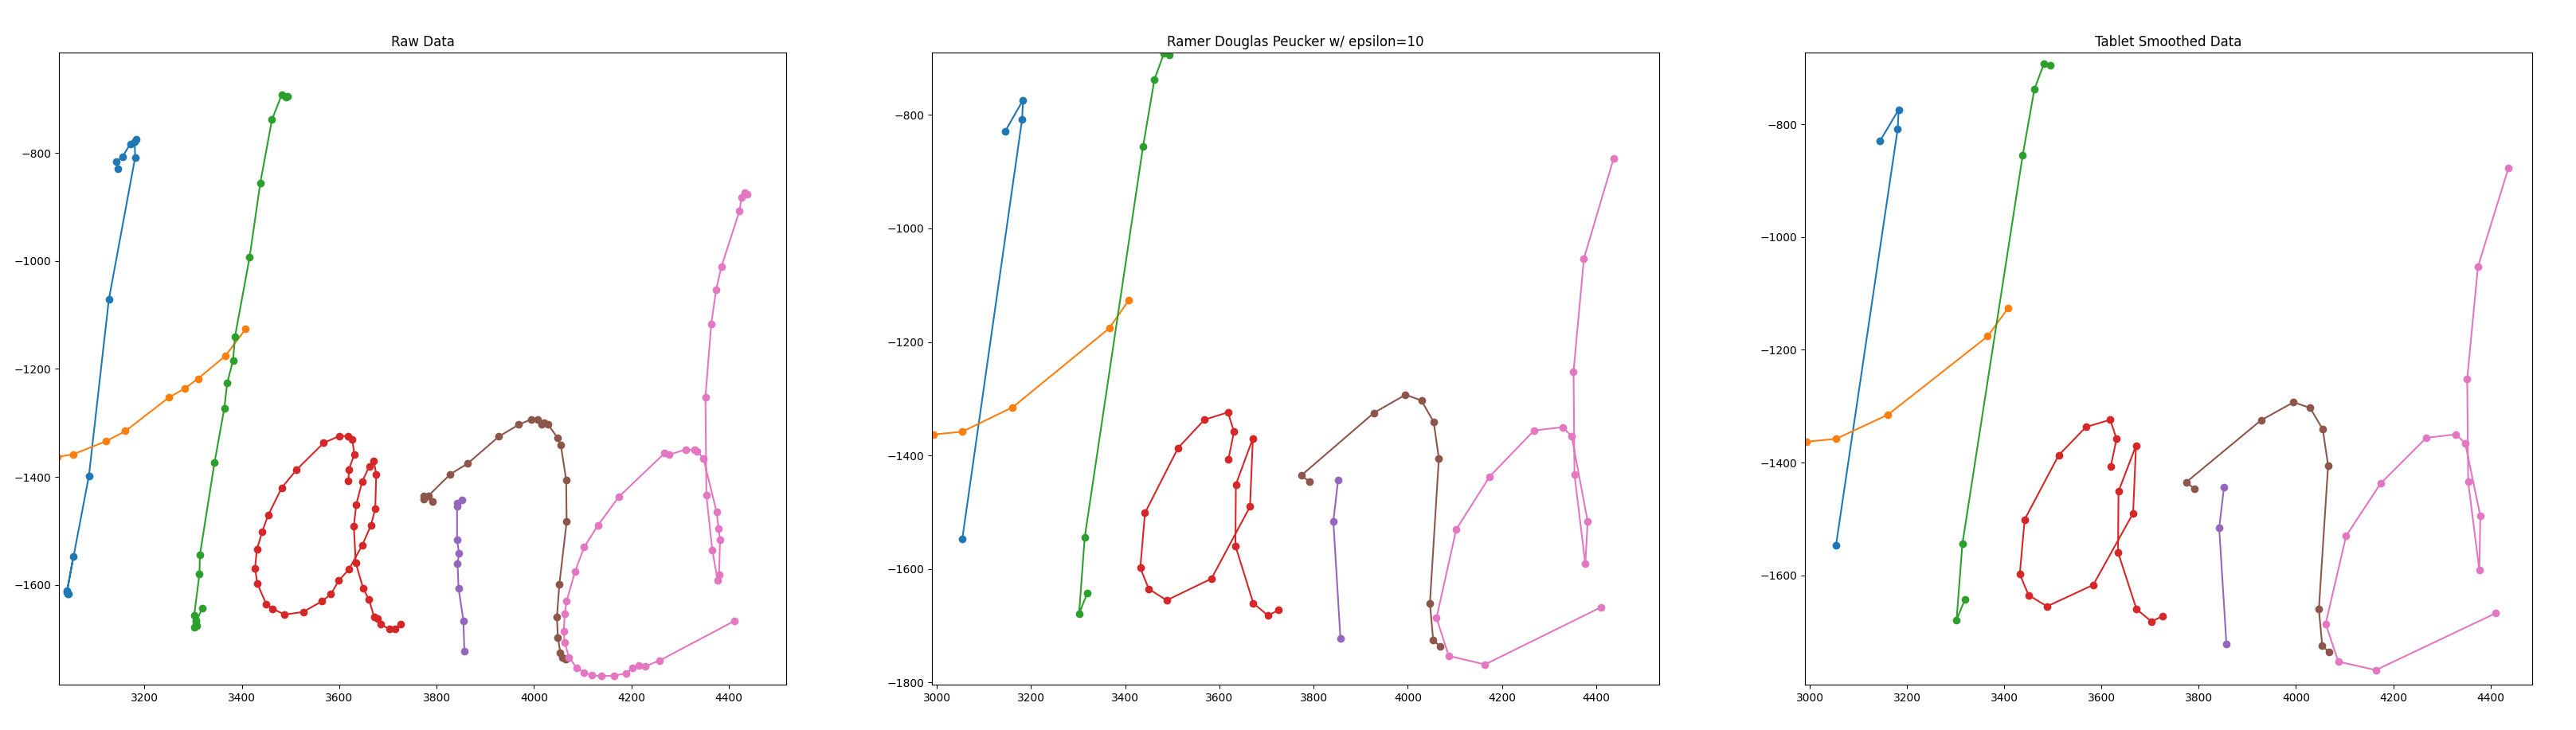
The following images show initial plotting of the line segments from the binary lines files vs the data sent by the tablet to the HWR service:
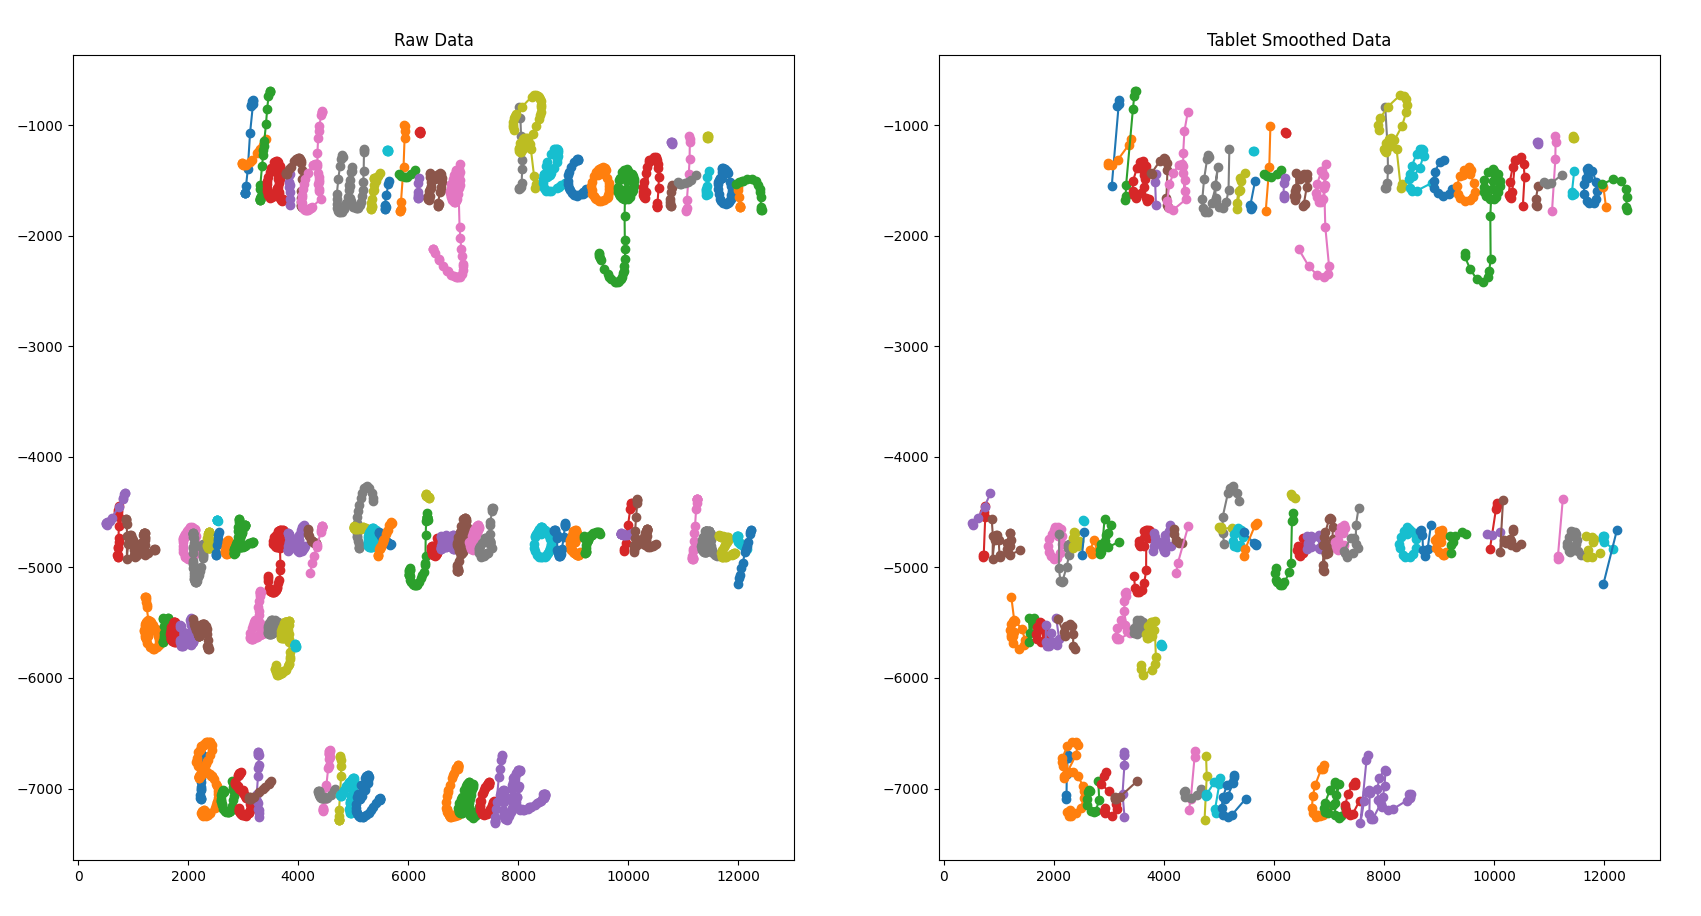
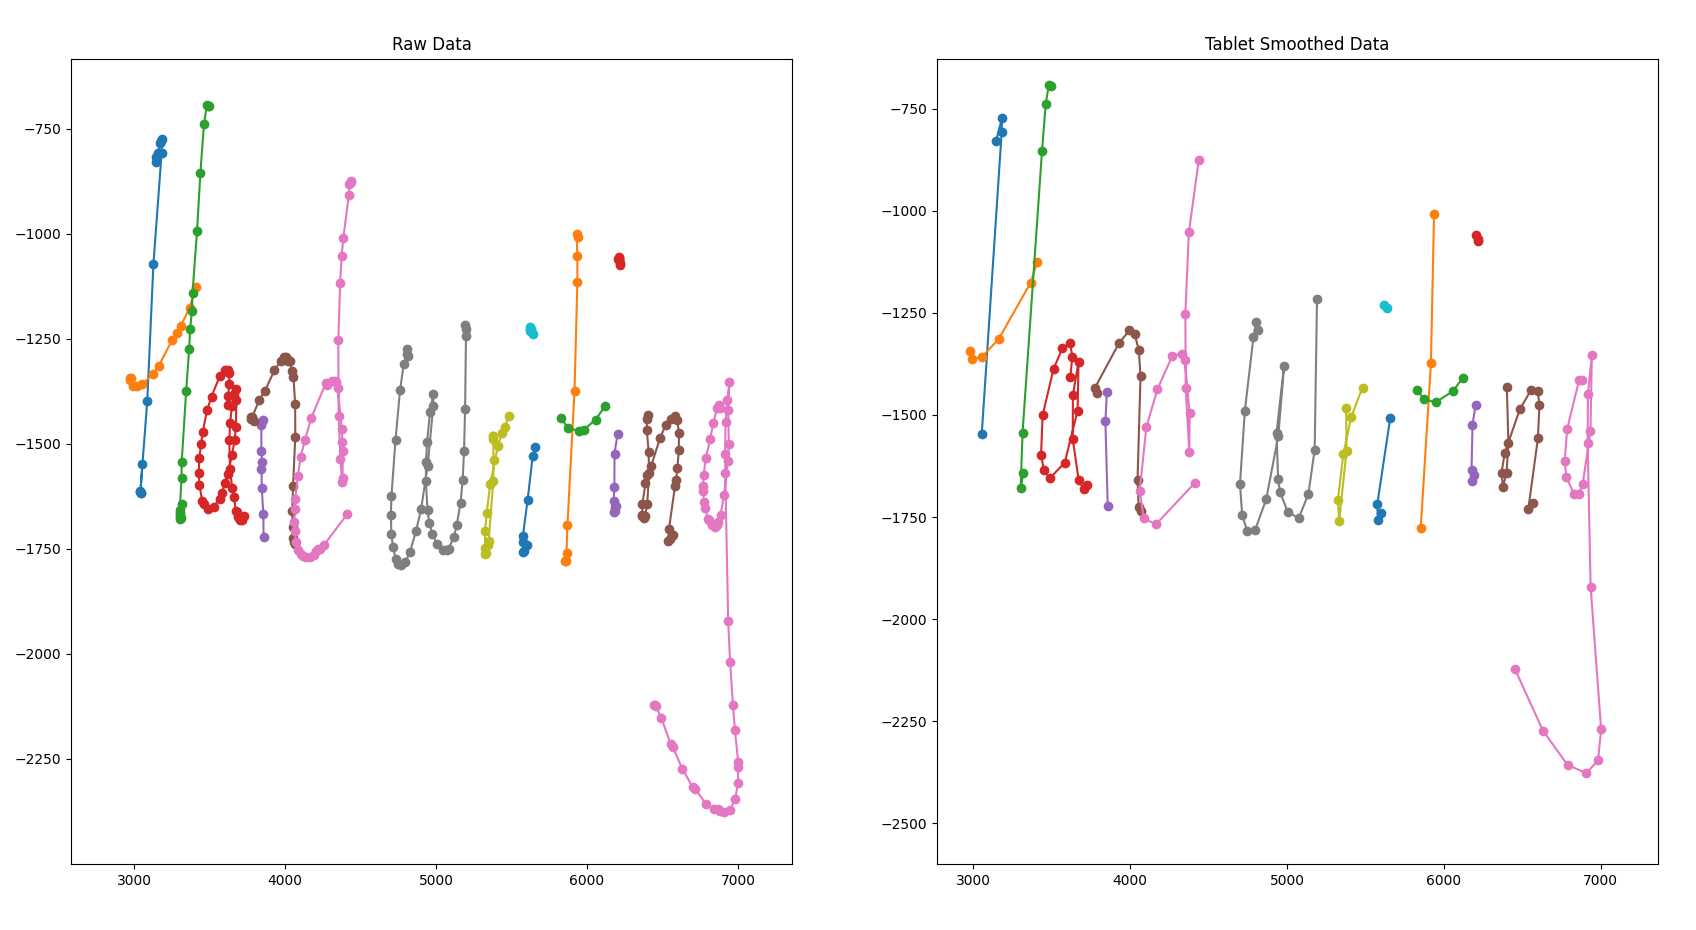
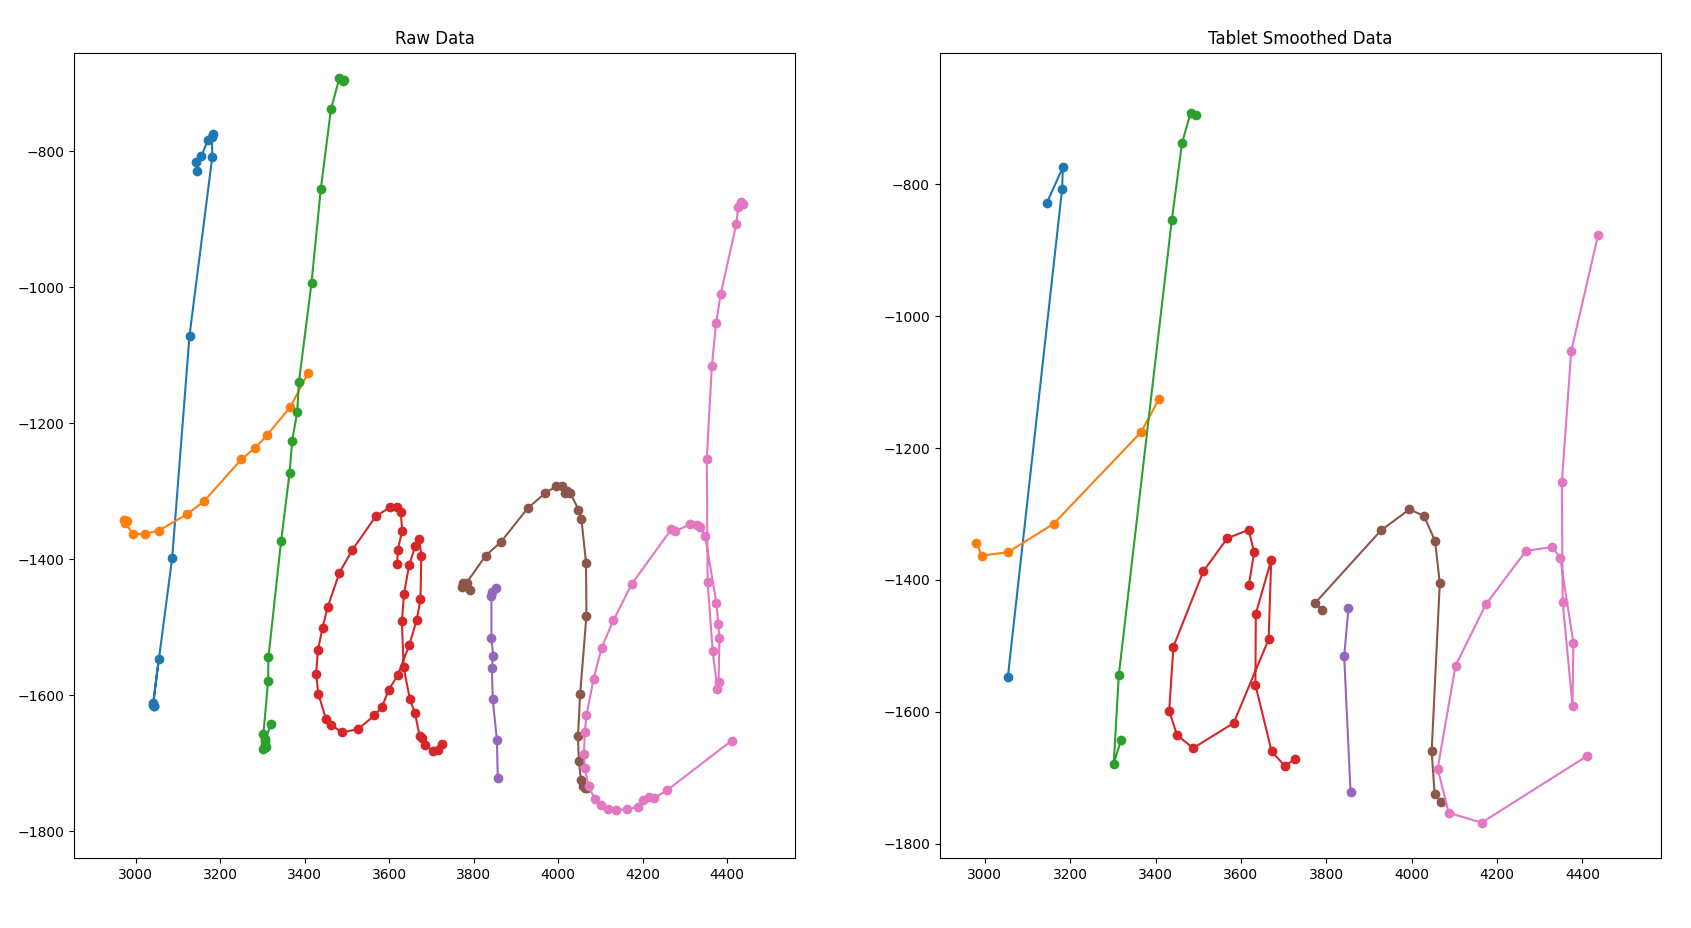
These images show the difference between the raw data and what the tablet is sending to the HWR service.
The above images were generated with matplotlib, here is the script:
 1
 2
 3
 4
 5
 6
 7
 8
 9
10
11
12
13
14
15
16
17
18
19
20
21
22
23
24
25
26
|
import matplotlib
import numpy as np
import matplotlib.pyplot as plt
import json, sys, time

def main():
    fig, (ax1, ax2) = plt.subplots(1, 2) # one row of two subplots

    ax1.set_title('Raw Data')
    with open("./raw.json") as f:
        hwrdata = json.load(f)

    for stroke in hwrdata["strokeGroups"][0]['strokes']:
        ax1.plot(stroke['x'], np.array(stroke['y']) * -1, '-o')
    # ---------------------
    ax3.set_title('Tablet Smoothed Data')
    with open("./tablet.json") as f:
        hwrdata = json.load(f)

    for stroke in hwrdata["strokeGroups"][0]['strokes']:
        ax3.plot(stroke['x'], np.array(stroke['y']) * -1, '-o')

    plt.show()

if __name__ == '__main__':
    main()
|
Initial searching took me to this Stack Overflow post
The example Mike Bostock made showing the use of an algorithm for cartographic simplification, be sure to check out this demo.
Mike’s demo took me to the Wikipedia entry for the Ramer Douglas Peucker (RDP) algorithm. Just below the psuedocode there is a link to a great demo by Marius Karthaus which is worth playing with. By playing with Marius' demo I became convinced that the RDP algorithm warranted some testing.
Expanding on the script from above to add a third subplot using the RDP algorithm to filter the points.
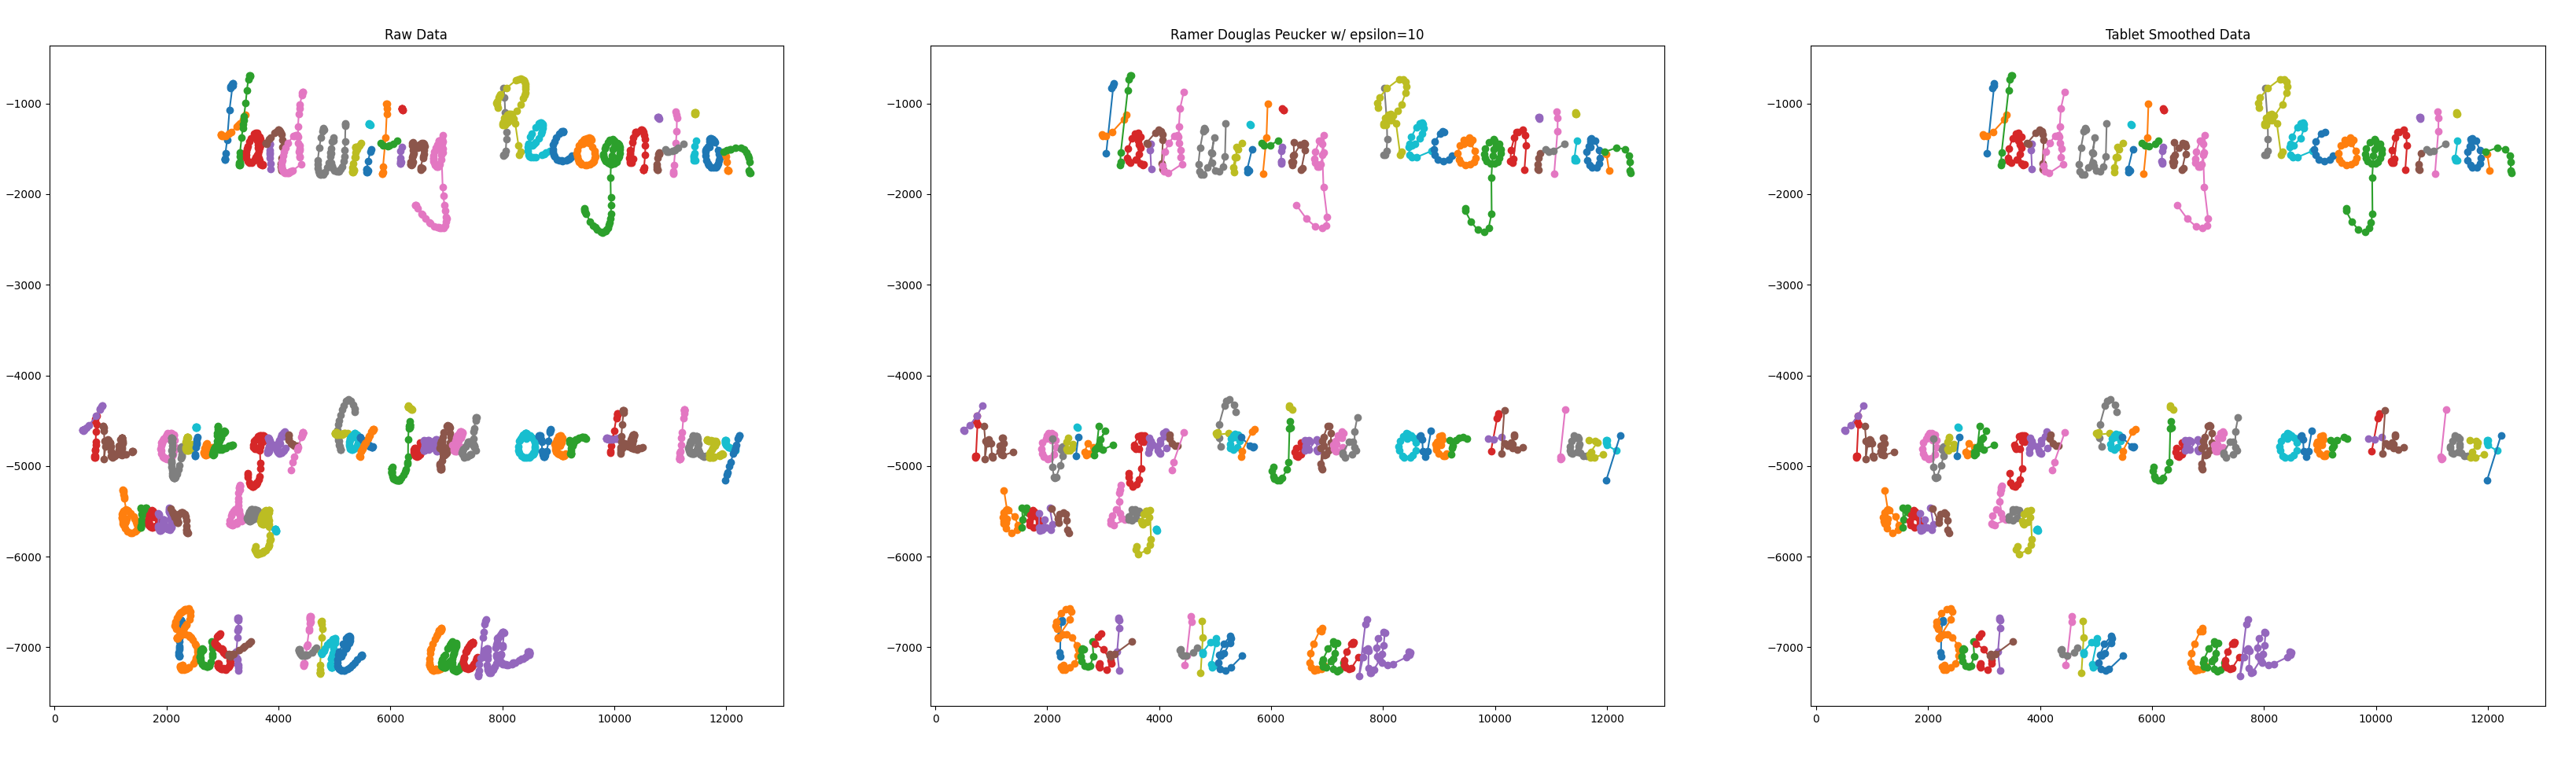
Here is the python script with the addition of RDP:
 1
 2
 3
 4
 5
 6
 7
 8
 9
10
11
12
13
14
15
16
17
18
19
20
21
22
23
24
25
26
27
28
29
30
31
32
33
34
35
36
37
38
39
40
41
42
43
44
45
46
47
48
49
50
51
52
53
54
|
import matplotlib
import numpy as np
import matplotlib.pyplot as plt
import json
import sys
import time

# Ramer–Douglas–Peucker algorithm
from rdp import rdp


def main():
    fig, (ax1, ax2, ax3) = plt.subplots(1, 3) # one row of three subplots


    ax1.set_title('Raw Data')
    with open("./raw.json") as f:
        hwrdata = json.load(f)

    for stroke in hwrdata["strokeGroups"][0]['strokes']:
        ax1.plot(stroke['x'], np.array(stroke['y']) * -1, '-o')
        # break

    # ---------------------

    epsilon=10
    ax2.set_title('Ramer Douglas Peucker w/ epsilon={}'.format(epsilon))
    with open("./raw.json") as f:
        hwrdata = json.load(f)

    for stroke in hwrdata["strokeGroups"][0]['strokes']:
        x = stroke['x']
        y = np.array(stroke['y']) * -1

        data = np.column_stack((x,y))

        res = rdp(data, epsilon=epsilon)
        res = np.column_stack(res)

        ax2.plot(res[0], res[1], '-o')

    # ---------------------

    ax3.set_title('Tablet Smoothed Data')
    with open("./tablet.json") as f:
        hwrdata = json.load(f)

    for stroke in hwrdata["strokeGroups"][0]['strokes']:
        ax3.plot(stroke['x'], np.array(stroke['y']) * -1, '-o')

    plt.show()

if __name__ == '__main__':
    main()
|
Link to sample of raw.json and here is tablet.json
By visual inspection it appears the RDP with epsilon of 10 achieves the desired goal of closely matching the tablet-generated set of points.
